Base exchange rate: 1 USD = 1,486 KRW (as of 2026-04-25)
Executive Summary
| item | detail |
|---|---|
| Current stock price | $323.46 (approx. 480,641 won) |
| Investment Opinion | HOLD |
| 12-month target price (default) | $345 (approx. 512,670 won) |
| Expected rate of return | +6.7% |
| Market capitalization | $124.2B (approx. 184 trillion 621.2 billion won) |
| 52-week range | $80.51 ~ $330.30 |
| Analyst consensus | Buy (23 out of 25 Buy) |
Vertiv Holdings (NYSE: VRT), a global leader in AI data center power management and cooling infrastructure, achieved an earnings surprise by reporting an adjusted EPS of 1.17 in the first quarter of 2026, exceeding the consensus by 15.71.
Sales recorded 2,649.5M (approximately 3.9391 trillion won), up 30.11T from the same period last year, and the adjusted operating profit margin was 20.81T, expanding by 430bp from the previous year.
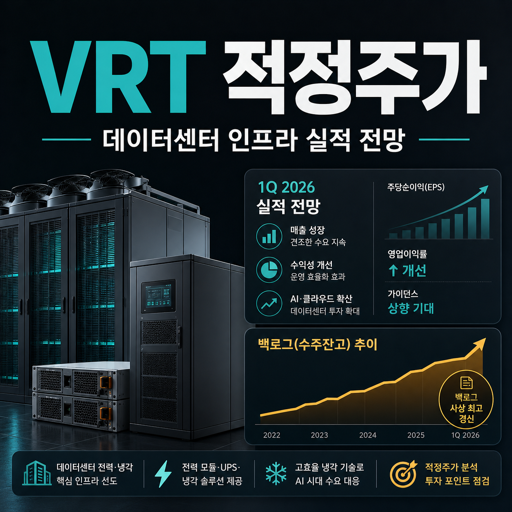
The company has raised its full-year revenue guidance for 2026 to 13.5B–14.0B, and against the backdrop of the AI data center construction boom, its order backlog has reached 15B (+1091B YoY).
However, valuation concerns persist due to the explosive stock price surge of +2,751 TP3T on a 52-week basis, and the fact that Q2 guidance slightly underperformed the consensus is a short-term risk factor. While strong fundamentals and benefits from AI are evident, the current stock price already reflects these factors significantly, so we recommend a HOLD.
- Q1 2026 Adjusted EPS 1.17 TP4T, +15.71 TP3T over consensus, earnings surprise
- Upward revision of overall 2026 guidance – Revenue $ 13.5B~$ 14.0B, EPS $ 6.30~$ 6.40
- Order backlog $15B (+109% YoY), high visibility with Book-to-Bill ratio of 2.9x
- Excellent cash generation capability with TTM Free Cash Flow (FCF) of 2,276M (approximately 33.8069 trillion KRW).
- Valuation burden after 52-week surge of +2,751 TP3T, similar to analyst average target price of 1 TP4T324
Company Overview
Vertiv Holdings Co. designs, manufactures, and services core digital infrastructure technologies and lifecycle services for data centers, telecommunications networks, and industrial environments, and is headquartered in Westerville, Ohio.
Approximately 34,000 employees worldwide operate in three regions: Americas, APAC, and EMEA, and the company was listed on the NYSE in 2020.
Major Business Segments and Revenue Composition
| Business Division | Main Products |
|---|---|
| Power Management | AC/DC UPS, Switchgear, Power Distribution (PDU), Energy Storage |
| cooling system | Air-cooled/liquid-cooled precision air conditioning, chillers, immersion cooling |
| Integrated Solution | Modular data center, rack system, monitoring software |
| service | Preventive maintenance, remote monitoring, engineering consulting, spare parts |
Our core brands include Vertiv, Liebert (UPS/cooling), NetSure (communication power), Geist (PDU/environmental monitoring), and Avocent (KVM/remote management).
competitive landscape
Vertiv is competing for the top two spots in the global precision cooling market with Schneider Electric (22%) with a market share of 23%.
Major competitors include Schneider Electric, Eaton, ABB, Delta Electronics, and Stulz, and Vertiv has established a leading position in the field of liquid cooling solutions specialized for AI data centers.
Financial Performance Analysis (Last 4 Quarters)
Quarterly Sales and Profit Trends
| branch | Sales (USD M) | Converted to Korean Won | YoY growth | Gross Profit Margin | Adjusted operating profit margin |
|---|---|---|---|---|---|
| Q2 2025 | $2,638.1M | Approximately 3.9202 trillion won | – | 34.0% | ~17% |
| Q3 2025 | $2,675.8M | Approximately 3.9764 trillion won | – | 37.8% | 20.5% |
| Q4 2025 | $2,880.0M | Approximately 4.2797 trillion won | – | 38.9% | 21.1% |
| Q1 2026 | $2,649.5M | Approximately 3.9391 trillion won | +30.1% | 37.7% | 20.8% |
| TTM Total | $10,843.4M | Approximately 161 trillion 153.7 billion won | – | 37.2% | – |
Quarterly EPS and Net Profit
| branch | Net Profit (USD M) | Diluted EPS (GAAP) | Adjusted EPS | Net profit margin |
|---|---|---|---|---|
| Q2 2025 | $324.2M (approx. 481.7 billion KRW) | $0.83 | – | 12.3% |
| Q3 2025 | $398.5M (approx. 592.2 billion KRW) | $1.02 | – | 14.9% |
| Q4 2025 | $445.6M (approx. 662.1 billion KRW) | $1.14 | – | 15.5% |
| Q1 2026 | $390.1M (approx. 579.7 billion KRW) | $0.99 | $1.17 ★ | 14.7% |
| TTM Total | $1,558.4M (approx. 23 trillion 157.9 billion KRW) | $4.01 | – | 14.4% |
★ Q1 2026 adjusted EPS of 1.17 grew rapidly by approximately 1,781 TP3T compared to 0.42 (GAAP) in the same period last year, and is a strong earnings surprise exceeding the Wall Street consensus of 1.00 by 15.71 TP3T.
Details of recently announced earnings (Q1 2026)
Q1 2026 results, announced on April 22, 2026, recorded strong performance overall.
| item | Actual value | Consensus estimate | result |
|---|---|---|---|
| sales | $2,649.5M (approx. 3.9391 trillion won) | $2,637M | Slightly exceeding |
| Adjusted EPS | $1.17 | $1.00 | +15.7% Surprise ★ |
| Adjusted operating profit margin | 20.8% | ~18% | +430bp expansion |
| Americas' organic growth | +44% | – | stress |
| EMEA Organic Growth | -29% | – | slump |
Financial Health (as of Q1 2026)
| item | Amount (USD M) | Converted to Korean Won |
|---|---|---|
| Cash and short-term investment | $2,500.5M | Approximately 37 trillion 157.4 billion won |
| Total debt | $3,264.9M | Approximately 48 trillion 516.4 billion won |
| Net Debt | $771.6M | Approximately 1.1466 trillion won |
| Debt-to-Equity Ratio (D/E) | 75.21% | – |
| Current ratio | 1.494 | – |
| Current ratio | 1.057 | – |
| ROE | 45.1% | – |
| ROA | 11.1% | – |
Quarterly Trend of Free Cash Flow (FCF)
| branch | Operating cash flow | CapEx | FCF | Converted to KRW (FCF) |
|---|---|---|---|---|
| Q2 2025 | $322.9M | -$45.9M | $277.0M | Approximately 411.6 billion won |
| Q3 2025 | $508.7M | -$46.7M | $462.0M | Approximately 686.5 billion won |
| Q4 2025 | $978.9M | -$95.0M | $883.9M | Approximately 1.3134 trillion won |
| Q1 2026 | $766.8M | -$114.0M | $652.8M | Approximately 970.1 billion won |
| TTM Total | $2,577.3M | -$301.6M | $2,275.7M | Approximately 33 trillion 806.9 billion won |
TTM FCF $2,275.7M (approximately 33.8069 trillion KRW) represents a significant improvement over the previous year, demonstrating Vertiv's strong cash generation capabilities.
It is positive that the growth in operating cash flow significantly exceeds the increase in CapEx (capital expenditure) to meet the surge in demand for AI data centers.
Please also refer to Vertiv's previous analysis report: Vertiv (VRT) Previous Investment Analysis Report
Valuation Analysis
| characteristic | Current value | Reference Standards |
|---|---|---|
| Trailing P/E | 80.66x | Based on GAAP TTM EPS $4.01 |
| Forward P/E | 39.77x | Based on 2027E EPS $8.13 |
| P/S (TTM) | 11.46x | TTM sales based on $10.84B |
| P/B | 31.39x | Based on book value $10.30/share |
| EV/EBITDA | 52.41x | TTM EBITDA basis |
| PEG ratio | 1.98x | Reasonable level relative to the growth rate |
| FCF multiplier | Approximately 54.6x | Based on TTM FCF $2,276M |
While the current valuation is high in absolute terms, it is difficult to conclude that it is excessively overvalued considering the premium as an infrastructure company that will be the biggest beneficiary of AI data centers and a growth rate of around 301 TP3T.
Given that the industry average Forward P/E is around 25–35 times, Vertiv is trading at a premium of approximately 15–201 TP3T.
Analyst consensus target price
| division | Target price | Converted to Korean Won |
|---|---|---|
| Average target price | $324.44 | Approximately 482,118 won |
| Median target price | $345.00 | Approximately 512,670 won |
| The ultimate goal is | $394.00 | Approximately 585,484 won |
| Lowest target price | $155.00 | Approximately 230,330 won |
| Current stock price | $323.46 | Approximately 480,641 won |
Although 23 out of 25 Wall Street analysts have a buy recommendation, the average target price ($324) is nearly equal to the current stock price ($323), so there is limited room for further short-term upside.
AI data center infrastructure related stocks Marvell Technology (MRVL) Analysis Report와 Oracle (ORCL) Stock Price Outlook AnalysisReferring to this as well will help you understand the overall picture of AI infrastructure investment.
Growth Outlook
Full guidance for 2026
| item | 2026E Guidance | note |
|---|---|---|
| sales | $13.5B ~ $14.0B | Median $13.75B (approx. 204 trillion 405 billion won) |
| Adjusted EPS | $6.30 ~ $6.40 | Median $6.35 |
| Adjusted operating profit | Approx. $3.2B | Approximately 47 trillion 552 billion won |
| Adjusted operating profit margin | 23.3% | Continued YoY expansion |
Key Growth Drivers
The surge in power demand for AI data centers is the first driver. Data center power consumption is projected to increase by more than 151 TP3 T per year between 2025 and 2030, and Vertiv is a key beneficiary of this demand.
The structural growth of the liquid cooling market is the second driver. As the thermal density of AI GPUs increases rapidly, the transition from traditional air cooling to liquid cooling is accelerating, and Vertiv possesses leading technological capabilities in this market.
The third driver is an all-time high order backlog. An order backlog of 1 TP 4 T 15 B (+1091 TP 3 T YoY) and a book-to-bill ratio of 2.9x significantly enhance future revenue visibility.
Growth rate estimates and 2027 forecast
| item | 2026E | 2027E |
|---|---|---|
| sales | $13.75B (approx. 204 trillion won) | ~$17B (approx. 252 trillion 620 billion won) |
| Adjusted EPS | $6.35 | $8.13 (Based on Forward EPS) |
| EPS growth rate | +42~45% YoY | +28% YoY (Estimated) |
Stock Price Scenario (12 Months)
| scenario | Target price | Converted to Korean Won | Expected rate of return | Probability | Prerequisites |
|---|---|---|---|---|---|
| Base | $345 | Approximately 512,670 won | +6.7% | 50% | 2027E EPS $8.13, P/E 42x applied |
| Bull | $408 | Approximately 606,288 won | +26.2% | 25% | EPS exceeds $9.5, P/E 43x |
| Bear | $240 | Approximately 356,640 won | -25.8% | 25% | EPS $7.5, P/E 32x (Tariffs and EMEA weakness) |
Expected rate of return: $345 × 50% + $408 × 25% + $240 × 25% = $332.75, which is approximately +2.9% compared to the current rate.
The expected return is less than +151 TP 3T, which meets the HOLD criteria. However, considering the strong fundamentals and the structural growth of AI infrastructure, a strategy of looking for staggered buying opportunities during corrections (1 TP 4T 280~300) is valid.
Recent Major Issues and Catalytic Factors
Q1 2026 Earnings Surprise (April 22, 2026): Achieved adjusted EPS of 1.17 TP4T, up 15.71 TP3T from the consensus, and revenue of 30.11 TP3T YoY, confirming the sustainability of demand for AI data centers.
2026 Overall Guidance Upgraded: Revenue has been revised upward from previous estimates to 13.5B–14.0B and Adjusted EPS to 6.30–6.40. The Adjusted Operating Profit Margin guidance of 23.31T suggests that the margin improvement trend will continue.
Q2 2026 guidance slightly underperformed consensus: Revenue was $3.35 billion (down $2.31 from consensus $3.41) and EPS was $1.40 (down from consensus $1.43), which was a short-term disappointment. However, considering the base effect in the second half and the absorption of large orders, the full-year guidance is achievable.
Order Backlog $15B (+109% YoY): With an all-time high order backlog, Q4 2025 marked the largest order quarter in the company's history. A book-to-bill ratio of 2.9x indicates that there will be no shortage of demand for the time being.
Citi, TD Cowen Raise Target Price (April 2026): Citi and TD Cowen raised their target prices to $340 and $347, respectively, confirming the continued benefits from AI infrastructure.
Insider Stock Sale $102M: This is profit-taking sales by long-term executives. While caution is needed regarding short-term sentiment, it is difficult to interpret it as a pessimistic signal regarding the company's outlook.
To compare investment opportunities across the entire AI data center ecosystem Optoelectronics (AAOI) Analysis ReportPlease also check this.
Risk factors
The first risk is the burden of high valuation. Following a surge of +2,751 TP3T on a 52-week basis, the stock is trading at a trailing P/E of 80x and 55x FCF; there is a significant risk of a sharp decline in the event of disappointing guidance or a macroeconomic shock.
The second risk is the sluggishness in the EMEA region. With an organic growth rate of -291 TP3T in Q1 2026, European energy price instability and geopolitical risks are limiting demand in this region.
The third risk is supply chain and tariff uncertainty. Changes in global trade policies can affect the cost structure of raw materials and components, putting pressure on margins.
The fourth risk is the hyperscaler CapEx cycle risk. If the data center capital investment cycles of major cloud companies such as Microsoft, Amazon, and Google turn downward, it could lead to a slowdown in orders.
The fifth risk is intensifying competition. Major global competitors, such as Schneider Electric and Eaton, are stepping up their efforts to capture the AI infrastructure market, which could pose a challenge to maintaining long-term market share.
Investment Opinion Summary
| item | detail |
|---|---|
| Investment Opinion | HOLD |
| Level of certainty | Medium |
| Investment period | 12 months |
| Target Price (Basic) | $345 (approx. 512,670 won) |
| Expected rate of return | +6.7% (Base) / +2.9% (Based on expected value) |
Vertiv (VRT) is a global leader in AI data center power management and cooling infrastructure, and its fundamentals are outstanding. Revenue growth of 301%, improved margins, an order backlog of 15 billion, and strong cash generation capabilities are clear investment attractions.
However, following the 52-week surge of +2,751 TP3T, the current stock price largely reflects a strong growth scenario, and the average analyst target price (1 TP4T324) is also at the current stock price level.
Therefore, rather than making new purchases at current levels, it is effective for existing investors to maintain their positions, while non-owners should adopt a strategy of staggered buying during corrections (in the 1TP/4T 280–300 range). The structural growth potential benefiting from AI data center infrastructure is very positive in the long term.
This analysis is provided for investment reference only, and the investor is solely responsible for investment decisions. Base exchange rate: 1 USD = 1,486 KRW (as of 2026-04-25)
※ This analysis utilized AI tools during the writing process, and the final content has been verified by the author. It is for informational purposes only, and investment decisions and responsibilities lie solely with the investor.