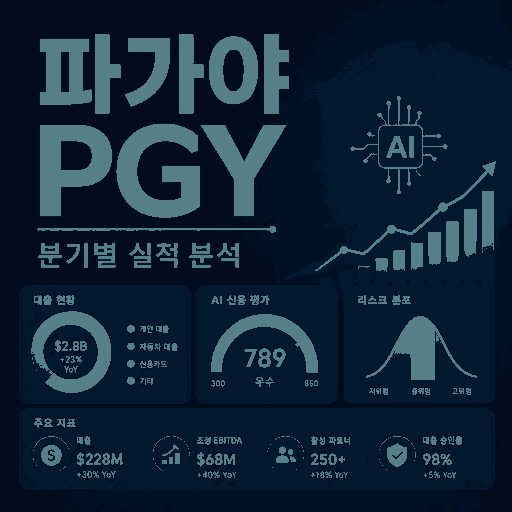
Complete Analysis of Pagaya (PGY) Performance
Is Pagaya a company worth investing in?
📅 August 2025 Analysis | 💰 Nasdaq: PGY | 🏷️ Fintech, AI, Lending Platform
🔍 Introduction: Why Pagaya Technologies Now?
One of the companies receiving the most attention in the fintech industry recently is none other than Pagaya TechnologyThis company, which operates an AI-based lending platform, has been showing remarkable performance growth since the beginning of 2025. Pagaya, which had recorded continuous losses since its IPO, has finally Transition to profitabilityIt has succeeded and is attracting investor attention by achieving a GAAP profit for two consecutive quarters. Just how capable is this company truly?💡 Key Points
• Achieved first-ever GAAP profit since listing starting Q1 2025 • Possesses differentiated competitive edge through AI-based loan underwriting • Simultaneously achieved an annual revenue growth rate of 301 TP3T and margin improvement • Ranked No. 1 issuer of U.S. personal loan ABS • Debt ratio rises to 175.61 TP3T, requiring monitoring
Pagaya Detailed Financial Statement Analysis
Key Performance Indicators
30%
Sales Growth Rate (YoY)
Q2 2025
$17M
Q2 2025 Net Profit
+$91M YoY
72%
EBITDA growth rate
Q2 2025 YoY
4.8%
FRLPC margin
Continuous improvement
Detailed Analysis of Revenue
📈 Latest 2025 Performance
Detailed Analysis of Operating Income
Detailed Analysis of Net Income
⚠️ Caution: The widening net loss in 2024 was primarily caused by non-cash items, such as the adjustment of the fair value of the investment portfolio ($156M).
🎉 Turnaround to Net Profit in 2025 (GAAP)
FRLPC (Fee Revenue Less Production Costs) Margin Analysis
Detailed Analysis of Adjusted EBITDA
2025 EBITDA (Latest)
Detailed Analysis of the Balance Sheet
Asset composition (as of December 31, 2024)
⚖️ Debt and Capital Structure
Detailed analysis of the debt ratio
⚠️ Caution: The increase in debt is attributed to the issuance of ABS and expanded borrowing for business expansion.
Summary of Key Financial Ratios
Profitability ratio
Growth ratio
stability ratio
2025 Guidance and Outlook
Expected performance for the full year 2025
📈 Key Driver of the Turnaround to Profitability
1. Improvement in FRLPC Margins
The Fee Revenue Less Production Costs margin increased significantly from 3.21 TP3T to 4.81 TP3T. This is attributed to improved accuracy of the AI-based underwriting system and an increased proportion of high-margin products.2. Realization of Operational Leverage
We confirmed economies of scale by reducing core operating costs to 491 TP3T compared to FRLPC.
3. Diversified Funding Strategy
We optimized financing costs through various financing methods, including ABS, institutional investors, and corporate bonds.
⚖️ Analysis of Pros and Cons from an Investment Perspective
🟢 Investment Appeal
- Profitability Transition Completed: GAAP surplus for two consecutive quarters
- AI Technology Superiority: Differentiated underwriting platform
- Market Leadership: No. 1 US Personal Loan ABS Issuer
- High growth rate: Annual 25-30% sales growth
- Margin Improvement: Achieved EBITDA margin level of 25%
- Diversified Funding: Stable financing structure
🔴 Investment Risk Factors
- Rise in debt ratio: Increased to 175.6%
- Interest Rate Sensitivity: Impact of Fed policy
- Credit Risk: Concerns over loan defaults during an economic downturn
- Intensified competition: AI Adoption by Existing Financial Institutions
- Regulatory Risk: Possibility of strengthening financial regulations
- Volatility: Stock price volatility due to the nature of growth stocks
Investment Opinion and Outlook
💎 Final Investment Opinion
Pagaya Technologies in the AI-based fintech industry Representative success stories of successful transitions to profitabilityBased on achieving consecutive profits in 2025 and strong growth momentum, we assess that the long-term investment value is very high. In particular, the differentiated competitiveness of the AI-based underwriting platform and diversified funding strategies are expected to become key drivers of sustainable future growth. However, the rise in the debt ratio requires continuous monitoring.📋 Considerations for Investing
🕐 Investment Timing: Currently in the early stages of transitioning to profitability, it is attractive from a mid-to-long-term investment perspective.
💰 Investment Weight: Adequate diversification is recommended at a portfolio level of 3-51 TP3T.
⏰ Monitoring Point: Quarterly FRLPC Margin, Debt Ratio, and Network Volume Growth Rate
🎯 Target Rate of Return: Expect an average annual return of 25-351 TP3T over the next 2-3 years
Disclaimer: This analysis represents a personal opinion based on publicly available financial information and does not constitute investment advice. Investment decisions should be made at one's own discretion and responsibility.
If you found this analysis report helpful, please share it! 🚀
※ This article was written based on publicly available data with the assistance of AI research tools, and the content was reviewed by the author prior to publication. It is for informational purposes only and does not constitute an investment recommendation.
Leave a Reply
You must be logged in to post a comment.