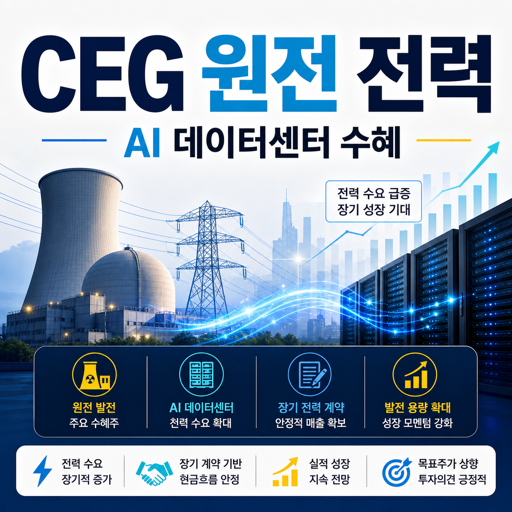
Constellation Energy (CEG) has become the largest private power producer in the U.S. with a generating capacity of approximately 55 GW following the completion of its acquisition of Calpine in January 2026. The investment opinion is Buyis, and the 12-month baseline target price is $360 (approx. 547,200 won)The key rationale is the securing of a long-term nuclear PPA of over 5,650 MW to meet the surge in power demand for AI data centers, along with a significant improvement in Q1 2026 earnings. The current share price of $294.07 (approximately 447,066 KRW) offers an attractive entry opportunity at a discount of about 23% from the analyst consensus target price of $380~384. ※ This analysis is for informational purposes only and does not constitute investment advice. We recommend consulting a professional before making any investment decisions.
Company Overview — Background of the U.S. Largest Nuclear Power Operator's Acquisition of Calpine
Constellation Energy is an independent power producer (IPP) founded in 2021 and headquartered in Baltimore, Maryland. January 2026 SEC 10-Q FilingAccording to [the company], it has significantly expanded its natural gas and renewable energy generation and retail energy platform by completing the acquisition of Kalpine worth 1 TP4T 21.835 B (approximately 33.1892 trillion KRW). It currently holds a diversified power generation portfolio of approximately 55 GW, including nuclear, natural gas, wind, solar, and hydropower.
Business Segments: It consists of five regional segments: Mid-Atlantic, Midwest, New York, ERCOT, and Other Power Regions. Key products and services include nuclear power generation (the largest nuclear power operator in the U.S., approximately 25 GW), natural gas and renewable energy generation (approximately 23 GW added through the acquisition of Calpine), long-term carbon-free PPAs for AI hyperscalers, competitive retail energy platforms (B2C and B2B), and RNG (renewable natural gas) production.
Business Model: It is a complex structure of wholesale power sales, long-term PPAs, and retail energy sales. It is enhancing revenue visibility through long-term contracts with hyperscalers such as Microsoft, Meta, and CyrusOne. While Vistra (VST), NRG Energy (NRG), and NextEra Energy (NEE) are major competitors in the competitive landscape, CEG holds the overwhelming number one position in terms of nuclear power generation scale.
Summary of Key Investment Terms — What Are PPA, Hyperscaler, and IPP?
| terminology | Full name | definition | Meaning in CEG |
|---|---|---|---|
| PPA | Power Purchase Agreement | Long-term power purchase agreement between power generation companies and buyers | 20-Year Nuclear Power Supply Contract with Microsoft and Meta |
| Hyperscaler | — | Large-scale cloud and AI data center operators (Microsoft, Meta, Google, Amazon, etc.) | Key customer group for CEG nuclear power long-term contracts |
| Nuclear Uprate | — | Power increase through modification of existing reactor design | Braidwood, Byron, and others pursuing 135MW upgrading |
| IPP | Independent Power Producer | Independent power generators that sell electricity at market prices, unlike regulated utilities | Direct exposure to the risk of fluctuations in wholesale electricity prices |
| OCF | Operating Cash Flow | Cash flow from operating activities | Based on TTM, it is approximately 1 TP 4 T 4.6 B. |
| RNG | Renewable Natural Gas | Renewable natural gas extracted from waste, biomass, etc. | Expansion projects including Pine Creek RNG are in progress |
| ERCOT | Electric Reliability Council of Texas | Texas Power Grid Operator | Pin Oak 460MW Gas Power Plant Newly Commissioned |
Financial Performance Analysis — The Real Reason Behind the Revenue Surge to 641 TP3 T in Q1 2026
An analysis of the results over the past four quarters confirms that the effects of the Kalpine acquisition are being fully reflected starting in Q1 2026. Q1 2026 Earnings Call TranscriptAccording to [source], the adjusted EPS was 2.74, exceeding the market estimate of 2.59 by 5.81.
| branch | Sales (USD) | Sales (Korean Won) | Operating profit | net profit | EPS (Dilution) |
|---|---|---|---|---|---|
| Q1 2026 (Mar) | $11.122B | Approximately 16 trillion 905.4 billion won | $2.266B | $1.590B | $4.49 |
| Q4 2025 (Dec) | $6.074B | Approximately 9.2325 trillion won | $0.806B | $0.432B | $1.38 |
| Q3 2025 (Sep) | $6.570B | Approximately 9.9864 trillion won | $1.459B | $0.930B | $2.97 |
| Q2 2025 (Jun) | $6.101B | Approximately 9.2735 trillion won | $0.502B | $0.839B | $2.67 |
The surge in Q1 2026 revenue of 63.81 TP3T compared to the same period last year (1 TP4T 6.788B) is due to the acquisition of Calpine, which was completed on January 7, 2026. Calpine possesses approximately 23 GW of natural gas and renewable energy generation capacity and a large-scale retail platform, and following the acquisition, CEG's total generation capacity nearly doubled to approximately 55 GW.
Quarterly Operating Margin Trend: Q1 2026 20.41 TP3T (first quarter with Calpine combined, favorable), Q4 2025 13.31 TP3T (seasonal off-season), Q3 2025 22.21 TP3T (summer peak demand), Q2 2025 8.21 TP3T (spring wholesale price low). Although quarterly operating margins fluctuate significantly due to the high fixed-cost structure of nuclear power generation, earnings stability is improving with the consolidation of Calpine's natural gas and retail businesses.
Financial Health and Free Cash Flow (FCF)
As of Q1 2026, total assets are $96.911B (approx. 147.3047 trillion KRW) and total liabilities are $22.466B (approx. 34.1483 trillion KRW), reflecting the leverage from the Kalpine acquisition. With a current ratio of 1.363 times, short-term liquidity is at an appropriate level.
| branch | Sales CF | capital expenditure | FCF |
|---|---|---|---|
| Q1 2026 | $425M | -$1,275M | -$850M |
| Q4 2025 | $805M | -$986M | -$181M |
| Q3 2025 | $1,848M | -$390M | $1,458M |
| Q2 2025 | $1,477M | -$767M | $710M |
| TTM Total | $4,555M | -$3,418M | $1,137M |
TTM FCF is approximately 1.137B (approximately 1.7282 trillion KRW), but this figure reflects the integration costs for the Kalpine acquisition in Q1 2026 and a large-scale capex (1.275B). FCF is expected to improve significantly following normalization (second half of 2026–2027), and the capital expenditure guidance for 2026 is 3.9B.
Valuation Assessment — DCF Analysis and Comparison with Current Stock Price
| characteristic | CEG | Sector Average (Utility IPP) | note |
|---|---|---|---|
| Trailing P/E | 25.6x | ~20x | Nuclear power premium |
| Forward P/E | 21.6x | ~18x | Before reflecting AI contract |
| P/B | 3.2x | ~2.0x | Nuclear asset scarcity |
| EV/EBITDA | 16.1x | ~12x | Calpine Leverage |
| PEG | 3.74 | ~2.0x | Reflecting expectations of high growth |
| Dividend yield | 0.58% | ~3% | Characteristics of growth stocks |
DCF Assumptions and Fair Stock Price Range
| DCF assumption items | Usage value | reason |
|---|---|---|
| Discount rate (WACC) | 9.5% | Beta 1.155, Risk-free rate 4.51 TP 3 T, Equity risk premium 51 TP 3 T |
| End-of-life value growth rate (g) | 2.5% | Long-term GDP growth rate + Nuclear licensing lifespan |
| forecast period | 5 years | Kalpine Integration Completed + AI Contract Visibility |
| Base FCF | $1.5B | TTM FCF $1.14B + Calfine Synergy Normalization Estimated |
| Bull FCF | $2.1B | Hyperscaler Additional Contract + Hack Upgrade Completed |
| Bear FCF | $0.9B | Falling electricity prices + delays in reactor maintenance |
Calculation formula: Fair Value (per share) = Σ [FCFₜ / (1+WACC)ᵗ] + Terminal Value / (1+WACC)⁵, Terminal Value = FCF₅ × (1+g) / (WACC − g)
DCF Fair Value Range: $310~$370 (approx. 471,200 KRW~562,400 KRW). The current share price of $294.07 (approximately 447,066 KRW) is lower than the lower end of the fair DCF range, placing it in a slightly undervalued zone. However, due to FCF uncertainty arising from the integration of Kalpine, achieving the lower end of the range at $310 is a prerequisite. Valuation Assessment: Slightly Undervalued
Competitor Comparison — Differentiators from Vistra, NRG, and NextEra
Regarding investment in AI power infrastructure Vertiv (VRT) AI Power Cooling Infrastructure AnalysisReferring to this together helps you grasp the overall picture of the power supply chain.
| item | CEG | Vistra (VST) | NRG Energy (NRG) | NextEra Energy (NEE) |
|---|---|---|---|---|
| Market capitalization | $106.2B (approx. 161 trillion 446.8 billion won) | ~$38B (approx. 57.76 trillion won) | ~$19B (approx. 28 trillion 880 billion won) | ~$150B (approx. 228 trillion won) |
| TTM Sales | $29.9B | ~$18B | ~$29B | ~$23B |
| TTM YoY Growth Rate | +64% (Calpine) | +7% | +3% | +15% |
| Operating margin (recent) | 20.4% | ~20% | ~8% | ~25% |
| Forward P/E | 21.6x | 18x | 12x | 20x |
| net debt | $21.7B (approx. 33 trillion won) | ~$19.6B | ~$7B | ~$40B |
| Key differentiators | Largest Nuclear Power + AI Contract | Nuclear power + Texas power generation | Retail energy concentration | Renewable Energy + Regulated Utility |
CEG holds an overwhelming advantage in nuclear scale (approximately 25GW) and the number of long-term AI hyperscaler contracts. While Vistra is the most direct competitor, it is cheaper with a Forward P/E of 18x and is stable due to its ERCOT-centric structure. NRG focuses on retail, while NextEra focuses on renewable energy, so their direct competition sectors differ.
Growth Outlook — Significance of the 5,650MW AI Data Center Power Contract
| Components | Estimated value | weight | source |
|---|---|---|---|
| Past Sales CAGR (2022~2025) | ~12% | 40% | yfinance financial statements |
| Analyst consensus growth rate | ~18% | 40% | 20 Analyst Consensus, 2026 EPS guidance |
| Industrial growth rate (AI power demand) | ~15% | 20% | AI Data Center Power Demand CAGR Forecast |
| Weighted growth rate | ~15.4% | 100% | Complex Estimation |
1) Surge in AI Data Center Power Demand: CEG has already secured long-term clean energy contracts exceeding 5,650 MW. It has signed a 20-year restart PPA for the Three Mile Island (Crane Clean Energy Center) with Microsoft, a 20-year PPA for the Illinois reactor with Meta, and a 380 MW supply contract with CyrusOne. As the only large-scale power source capable of providing stable, carbon-free electricity 24 hours a day, CEG holds an unrivaled position as a strategic partner for AI data centers.
2) Synergy from the Kalpine Acquisition: With the acquisition of Kalpine, valued at $21.835B (approximately 33.1892 trillion KRW), completed in January 2026, we have secured 23GW of natural gas and a large-scale retail energy platform. The combination of Kalpine's retail customer base and CEG's nuclear power is expected to generate cross-selling synergies and improve operational cost efficiency. From the perspective of power grid infrastructure investment, Quanta Service (PWR) Power Grid AI Data Center AnalysisIt is also worth referring to.
3) Nuclear Power Uprate and New Operation: The 135MW upgrading plan for existing reactors such as Braidwood and Byron, and the commercial operation of the Pin Oak Creek Energy Center 460MW natural gas power plant on April 30, 2026, are growth drivers.
2026 Revenue Forecast: Adjusted EPS $11.00~$12.00 (Guidance maintained), Company-wide revenue $40B+ (Annual Calpine effect), Capital expenditure $3.9B (Guidance), Share buyback $5B program approved.
Target Price Forecast — Analysis of 3 Scenarios
Currently, CEG is in the integration phase following the acquisition of Kalpine. While the AI power demand theme is structurally robust, there is a mix of uncertainties in the short term, including the absence of new hyperscaler contracts, delays in nuclear power plant restarts, and high debt. We balance the probabilities of positive and negative scenarios at 251 TP3 T each and set the normalization of Kalpine integration as the base scenario (501 TP3 T).
| scenario | Target price | Converted to Korean Won | Probability | reason |
|---|---|---|---|---|
| Base | $360 | Approximately 547,200 won | 50% | Forward P/E 26.5x × $13.59 FY2026E EPS |
| Bull | $430 | Approximately 653,600 won | 25% | New AI Contract Announced, Hack Uprate Accelerated, P/E 31.6x |
| Bear | $260 | Approximately 395,200 won | 25% | Falling electricity prices, continued contract gaps, debt burden |
Calculation of Expected Rate of Return: Expected Return = (0.50 × $360 + 0.25 × $430 + 0.25 × $260 − $294.07) / $294.07 = ($180 + $107.5 + $65 − $294.07) / $294.07 = +19.9% → Meets Buy criteria (>15%)
Recent Major Trends (February–May 2026)
Calpine acquisition completed (January 7, 2026): Total scale of 1 TP4T21.835B. Securing 23GW of generation capacity and a retail platform. This is the direct cause of the surge in revenue of 63.81 TP3T in Q1 2026.
DOE Eddystone Power Plant Maintenance Order (May 2026): The Department of Energy has ordered a delay in the early closure of two units at the Eddystone power plant in Pennsylvania to ensure the reliability of the PJM power grid. While this will incur short-term operating costs, it served as an opportunity to confirm the cooperative relationship with regulatory authorities.
Pin Oak Creek Energy Center Commercial Operation (April 30, 2026): 460MW Natural Gas Power Plant Begins Operation. ERCOT Market Stability Enhanced.
Rebound after stock price plunge (February–May 2026): After plunging from a 52-week high of 412.7 in January to a 52-week low of 243.3 in May (-41%), it has now recovered to the 294 level. The main causes were the lack of new data center contracts and delays in restarting nuclear power plants. It is currently undergoing a technical rebound from the 294 level.
Risk Factors — 4 Things You Must Check Before Investing
Risk 1: High debt burden (Calpine acquisition leverage)
Total debt surged to $22.466B (approximately 34.1483 trillion KRW) following the acquisition of Kalpine. The structure is such that rising interest rates lead to increased interest expenses, decreased net profit, lower EPS, and a reduction in valuation multiples. Monitoring Indicators: Announcement of quarterly interest coverage ratio (EBIT/interest expense), debt repayment schedule, and realization of Kalpine synergies.
Risk 2: Gaps in New AI/Data Center Contracts
Market concerns have spread due to the lack of announcements for new large-scale hyperscaler contracts entering 2026. If the AI capex cycle adjusts or contracts are snatched away by competitors, the nuclear premium valuation will disappear, and the stock price could converge to $240–250, which is the level of the sector average P/E (~18x). Monitoring Indicators: Quarterly IR contract announcements, competitor large contract trends, changes in AI capex guidance.
Risk 3: Delays in Nuclear Power Plant Restart and Uprates
There is a possibility that the restart of Three Mile Island and the Braidwood/Byron Uprate projects may be delayed due to technical issues or NRC regulations. Reduced production will lead to difficulties in fulfilling existing PPAs, resulting in compensation costs and a decline in revenue. Monitoring Indicators: NRC approval schedule, nuclear power plant quarterly capacity factor, maintenance notice schedule by plant.
Risk 4: Fluctuations in wholesale electricity prices
If an oversupply of renewable energy or a drop in natural gas prices lowers wholesale electricity prices, the revenue from uncontracted long-term PPAs decreases. Monitoring Indicators: PJM·ERCOT Futures Electricity Prices, Henry Hub Gas Prices, CEG Quarterly Hedge Ratio Disclosure.
Final Investment Opinion — Buy, Target Price $360
Investment Opinion: Buy | Medium-High Confidence | 12-Month Investment Period
- Basic Target Price: $360 (approx. 547,200 won), upside potential of +22.41 TP3T relative to current price
- Expected rate of return: +19.9%
- Suggested Position Weight: 3–51 TP3T of the total portfolio (Beta 1.155, volatility considered)
The current stock price appears to excessively reflect concerns regarding the Kalpine acquisition and a gap in short-term contracts. There is a high possibility of a stock price revaluation once Kalpine synergies become visible starting in the second half of 2026 and additional AI power demand contracts are announced. If you are interested in investing in power infrastructure... Eaton (ETN) AI Power Infrastructure AnalysisPlease also review this. ※ This analysis is for informational purposes only and does not constitute investment advice. We recommend consulting a professional before making any investment decisions.
Frequently Asked Questions (FAQ)
What is the 12-month target price for Constellation Energy (CEG)?
Based on the base scenario, the level is $360 (approx. 547,200 KRW), and we suggest a bullish range of $430 (approx. 653,600 KRW) and a bearish range of $260 (approx. 395,200 KRW). Based on a Forward P/E of 26.5x, the weighted expected return is approximately +19.9%, which falls within the Buy zone.
Why is CEG classified as a beneficiary of the AI data center power sector?
This is because CEG has signed long-term, carbon-free power contracts of over 5,650 MW with AI hyperscalers, including Microsoft (Three Mile Island 20-year PPA), Meta (Illinois Reactor 20-year PPA), and CyrusOne (380 MW PPA). As the only large-scale power source that supplies stable, carbon-free power 24 hours a day, nuclear power is an essential strategic partner for AI data centers.
Is CEG's current stock price overvalued or undervalued?
The forward P/E of 21.6x is slightly higher than the utility sector average (18–20x), but considering the strategic scarcity of nuclear assets and the AI contract premium, it is slightly undervalued. The current share price of $294.07 (approx. 447,066 KRW) is in a discount range compared to the DCF fair value range of $310–$370 (approx. 471,200 KRW–562,400 KRW).
Which is more attractive as an investment, CEG or Vistra (VST)?
While CEG surpasses VST in nuclear scale (approx. 25GW) and the number of AI contracts, VST is cheaper with a Forward P/E of 18x and offers higher earnings stability due to its concentration in ERCOT. VST has the advantage in short-to-mid-term valuation appeal, while CEG holds the edge in the scale of long-term benefits from AI power.
What is the biggest risk when investing in CEG?
The three major core risks are ① the debt burden from the acquisition of Kalpine (increased interest expenses when interest rates rise), ② the gap in new AI data center contracts (the direct cause of the sharp drop in stock price), and ③ delays in nuclear power plant restarts and uprates (decrease in operating rate → decrease in revenue). These are monitored through the quarterly interest coverage ratio, new contract announcements, and NRC approval schedules, respectively.
※ This content is based on publicly available data, written with the help of AI tools, and reviewed by the author. It is for informational purposes only and is not an investment recommendation.