Analysis Date: 2026-05-04 | Base Exchange Rate: 1 USD = 1,471 KRW
Executive Summary
Dell Technologies (NYSE: DELL) is a global IT hardware company that has emerged as the biggest beneficiary of the demand for AI infrastructure.
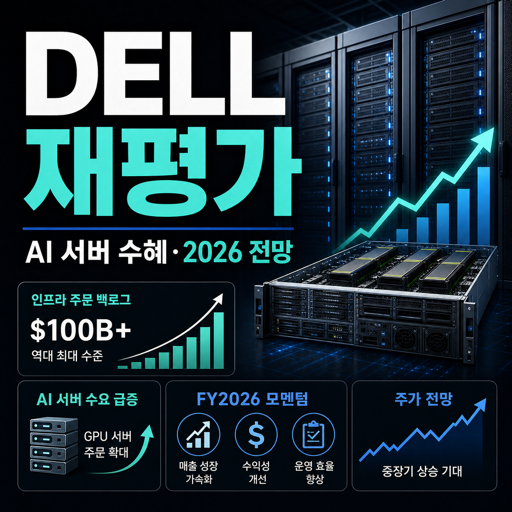
The current share price of 210.17 has risen 1271 from the 52-week low (92.53), and the company possesses strong growth drivers, including total AI server orders of 64 billion in FY2026 and a sales target of 50 billion for AI-optimized servers in FY2027.
| item | detail |
|---|---|
| Current stock price | $210.17 (approx. 309,060 won) |
| Investment Opinion | BUY |
| 12-month target price | $239 (Basic Scenario) |
| Expected rate of return | +13.7% |
| PEG ratio | 0.87 (Undervalued relative to growth) |
There are three key investment arguments.
- Unrivaled Position in AI Server Market: FY2026 AI Orders $64 billion, Order Backlog $43 billion (All-time High)
- FY2027 Guidance: Revenue $140 billion (+23%), Non-GAAP EPS Growth +25%
- The forward P/E of 14.3x is significantly undervalued relative to the 25% growth rate (PEG 0.87).
Company Overview
Dell Technologies was founded by Michael Dell in 1984 and is headquartered in Round Rock, Texas. It is a comprehensive IT company that globally supplies enterprise infrastructure, such as servers, storage, and networking, as well as client solutions, such as PCs and workstations.
The business is divided into the Infrastructure Solutions Group (ISG) and the Client Solutions Group (CSG), and as of Q4 FY2026, the ISG accounts for approximately 591 TP3T of revenue and the CSG accounts for approximately 411 TP3T.
Core products include AI-optimized servers (PowerEdge), traditional servers, all-flash storage, enterprise networking, and commercial and personal PCs, and the company generates revenue through an integrated solution model that combines hardware sales with software, services, and financing.
Major competitors are Hewlett Packard Enterprise (HPE) and Supermicro (SMCI), while Dell holds an advantage in the large enterprise and national-level AI infrastructure market with its strengths in global service and support capabilities and end-to-end solutions.
In the AI server market NVIDIA (NVDA) GPUDell's core competitive advantage is its ability to supply AI-optimized servers equipped with [specific technology/tool], and FY2026 AI server sales surged more than fourfold compared to the previous year.
Financial Performance Analysis (Based on the last 4 quarters)
Quarterly Sales and Profit Trends
| division | Q1 FY2026 (Apr'25) | Q2 FY2026 (Jul'25) | Q3 FY2026 (Oct'25) | Q4 FY2026 (Jan'26) |
|---|---|---|---|---|
| sales | $23,378M | $29,776M | $27,005M | $33,379M |
| Korean Won approx. | (34 trillion 388.9 billion won) | (43 trillion 790.5 billion won) | (39 trillion 724.4 billion won) | (49 trillion 101.5 billion won) |
| Gross profit | $4,937M | $5,447M | $5,593M | $6,730M |
| Operating profit | $1,165M | $1,773M | $2,168M | $3,145M |
| net profit | $965M | $1,164M | $1,548M | $2,259M |
| Diluted EPS | $1.37 | $1.70 | $2.28 | $3.37 |
TTM (Last 12 Months) Sum: Revenue $113,538M (approx. 167 trillion KRW), Net Profit $5,936M (approx. 8.7319 trillion KRW), EPS $8.68.
Q4 FY2026 was the strongest quarter in history, with revenue surging 391 TP3T year-over-year, directly reflecting the explosion in demand for AI servers.
Profitability Indicators (Quarterly Margin Trends)
| division | Q1 FY2026 | Q2 FY2026 | Q3 FY2026 | Q4 FY2026 |
|---|---|---|---|---|
| Gross profit margin | 21.1% | 18.3% | 20.7% | 20.2% |
| Operating profit margin | 5.0% | 6.0% | 8.0% | 9.4% |
| Net profit margin | 4.1% | 3.9% | 5.7% | 6.8% |
Q4 recorded the highest quarterly operating profit margin of 9.41 TP3T, and the sales leverage effect is beginning to materialize.
Despite the cost burden resulting from the increased proportion of AI servers, margin improvements are clearly evident due to the achievement of economies of scale.
Financial soundness (as of January 31, 2026)
| item | amount | Korean Won approx. |
|---|---|---|
| Cash and cash equivalents | $11,528M | 16 trillion 957.7 billion won |
| Total debt | $31,503M | 46 trillion 331.9 billion won |
| net debt | $19,975M | 29 trillion 384.2 billion won |
| Current ratio | 0.91 | – |
| Quick ratio | 0.594 | – |
The negative equity (-$2,470M) is a result of aggressive share buybacks and increased dividends, which is a normal financial structure given the nature of the business.
Quarterly Trend of Free Cash Flow (FCF)
| division | Q1 FY2026 | Q2 FY2026 | Q3 FY2026 | Q4 FY2026 | TTM Total |
|---|---|---|---|---|---|
| Operating cash flow | $2,796M | $2,543M | $1,172M | $4,674M | $11,185M |
| Capital expenditure (CapEx) | -$568M | -$675M | -$669M | -$721M | -$2,633M |
| FCF | $2,228M | $1,868M | $503M | $3,953M | $8,552M |
| Korean Won approx. | (Approximately 12.58 trillion won) |
TTM FCF $8,552M represents an FCF yield of 6.3% relative to a market capitalization of $136.65B, demonstrating excellent cash generation capabilities as a hardware company.
Recent Earnings Announcement (Q4 FY2026 Earnings Surprise)
| item | Actual | expectation | Surprise |
|---|---|---|---|
| sales | $33.4B | $31.6B | +5.7% |
| Non-GAAP EPS | $3.89 | $3.51 | +10.8% |
| YoY sales growth | +39% | – | – |
| YoY EPS growth | +45% | – | – |
Q4 AI server orders $34.1 billion, total FY2026 AI orders $64 billion, and AI order backlog $43 billion (all-time high).
ISG revenue recorded 19.6B (+731 TP3T YoY), of which AI optimization servers alone recorded 19.0B (+3421 TP3T YoY).
Dell announced approval of 54 million share buybacks, an increase in the annual dividend of 201 TP3T (2.52 TP4T/share) as part of its FY2026 shareholder returns, and an additional 10 billion TP4T for its share buyback program.
A key partner in AI data center cooling solutions Vertiv Holdings (VRT)Together with this, Dell is building a complete AI infrastructure ecosystem.
Valuation Assessment
Current valuation indicators
| characteristic | DELL current | Industry average | evaluation |
|---|---|---|---|
| Trailing P/E | 24.2x | ~18x | Somewhat high |
| Forward P/E | 14.3x | ~16x | Undervalued |
| P/S | 1.20x | ~1.5x | Undervalued |
| EV/EBITDA | 13.7x | ~12x | titration |
| PEG | 0.87 | ~1.2x | Undervalued |
The forward P/E of 14.3x is significantly low for a growth company, and the PEG ratio of 0.87 suggests clear undervaluation relative to growth.
The P/S of 1.2x is lower than that of peer hardware companies, and the TTM FCF-based FCF yield is 6.31 TP3T, which is an attractive level.
Valuation Determination: Fairly Valued ~ Slightly Undervalued
However, as the current stock price of $210 already exceeds the analyst consensus target price of $180–$187, there are concerns about overheating in the short term.
From the perspective of AI semiconductor design Broadcom (AVGO)'s ASICWith a structure installed on Dell's AI servers, the two companies are forming a mutually complementary relationship in the AI infrastructure ecosystem.
Growth Outlook
- FY2026 Revenue Growth: +191 TP3T YoY (Total), ISG +731 TP3T, CSG +141 TP3T
- FY2026 EPS Growth: +451 TP3T YoY (Based on Q4)
- AI Optimized Server Q4 Growth: +342% YoY
| item | FY2026 earnings | FY2027 Guidance | growth rate |
|---|---|---|---|
| Total sales | $113.5B (167 trillion won) | ~$140B (206 trillion won) | +23% |
| AI Optimized Server | ~$25B | ~$50B | +100% |
| Non-GAAP EPS | ~$14.74 | +25% growth | +25% |
The AI server order backlog amounting to $43 billion provides revenue visibility for at least one year.
National-level “Sovereign AI” projects (governments building their own AI infrastructure) are emerging as a new growth engine, and Dell is in a favorable position in the competition for large national contracts thanks to its end-to-end solution capabilities.
If the AI PC replacement cycle accelerates, additional growth in the CSG sector is also expected.
Price Forecast (1-Year)
| scenario | Probability | FY2028 EPS assumption | Applied P/E | Target price | Rate of return |
|---|---|---|---|---|---|
| Base | 50% | $18.43 | 13x | $239 | +13.7% |
| Bull | 25% | $18.43 | 16x | $287 | +36.6% |
| Bear | 25% | $14.74 | 13x | $191 | -9.1% |
Expected Rate of Return = ($239 × 0.5 + $287 × 0.25 + $191 × 0.25 – $210.17) / $210.17 = +13.7%
The base scenario assumes that the FY2027 guidance-based EPS of $14.74 grows to 25% to achieve FY2028 EPS of $18.43, and that a forward P/E of 13x is applied.
In a bullish scenario, the P/E ratio expands to 16 times due to the overachievement of AI server demand and valuation revaluation, in which case the target price reaches $287.
A bearish scenario occurs when EPS growth stagnates due to AI demand cycle adjustments or margin pressure, with $191 serving as a downside support level.
Recent Developments
① FY2026 Q4 Earnings Announcement (Feb. 26, 2026) — Revenue of $33.4B and AI orders of $34.1B both exceeded consensus.
It declared its commitment to strengthening shareholder returns by increasing the annual dividend by 201% (2.52%/share) and approving an additional 10 billion won share buyback.
② Explosion in Demand for AI Servers — Total AI orders recorded at $64 billion and AI server backlog at $43 billion in FY2026. ISG revenue is surging as shipments of NVIDIA Blackwell-based AI servers begin in earnest.
③ Strengthening Competitive Advantage — Enterprise customers' preference for Dell has intensified following SMCI's governance crisis. During the month of April 2026, the stock price rose by +281 TP3T, recording overwhelming performance compared to HPE (+211 TP3T) and SMCI (-71 TP3T).
④ CEO Remarks on Regulation (2026.04.15) CEO Michael Dell expressed opposition to a regulatory moratorium on AI development, warning that excessive regulation could benefit competing nations.
Key upcoming events: Q1 FY2027 earnings announcement (around May 28), and whether the FY2027 AI server order target of 1 TP 4 T 50 billion is achieved are key monitoring points.
Risk Factors
① AI Demand Cycle Risk If hyperscalers adjust their capital investment cycles, AI server orders could plummet, and the possibility cannot be ruled out that the current backlog of 1 TP 4 T 43 billion will not all be monetized.
② Margin pressure risk Profitability may decline due to rising raw material prices, such as NVIDIA GPUs, and supply chain costs. The current operating profit margin of 9.41 is low compared to software companies, and there are limits to margin improvement.
③ Intensified competition Re-competition for market share is inevitable once SMCI's governance crisis is resolved, and HPE's strengthening of its AI strategy (acquisition of Juniper Networks) is also a mid-to-long-term threat.
④ PC Market Uncertainty — Due to the cyclical sensitivity of CSG sales, corporate IT spending may decrease during a global economic downturn.
⑤ Valuation Risk — The current stock price of $210 has already exceeded the analyst consensus ($180~187), so there is a risk of a sharp decline if earnings expectations are lowered.
Investment Recommendation
BUY — Confidence Level: Medium
| item | detail |
|---|---|
| Investment Opinion | BUY |
| Level of certainty | Medium |
| 12-Month Target Price (Default) | $239 (approx. 351,369 won) |
| 12-Month Target Price (Bulk) | $287 (approx. 422,177 won) |
| 12-month target price (weak) | $191 (approx. 281,061 won) |
| Expected rate of return | +13.7% (Basic Scenario) |
| Investment period | 12 months |
A PEG ratio of 0.87 suggests that the company is clearly undervalued as a growth firm.
The FY2027 $ 50 billion AI server revenue target and $ 43 billion order backlog provide strong earnings visibility, and the forward P/E of 14.3x is an overly conservative valuation as a key beneficiary of the AI infrastructure supercycle.
However, as the current stock price exceeds the consensus target and approaches the 52-week high ($221.5), it is necessary to tolerate short-term volatility. A dollar-cost averaging strategy is recommended, and it is advisable to confirm momentum after the Q1 FY2027 earnings announcement (May 28).
This report is for informational purposes only and does not constitute an investment recommendation. Investment decisions must be made at your own discretion and responsibility.
Data Source: Yahoo Finance, Dell Technologies IR, Web Search (As of 2026-05-04) | Base Exchange Rate: 1 USD = 1,471 KRW
※ This content is based on publicly available data, written with the help of AI tools, and reviewed by the author. It is for informational purposes only and is not an investment recommendation.